BGGN 213 Spring 2019 Classwork
https://androidpcguy.github.io/bggn213/
Class 05: R Graphics
Akshara Balachandra 6/5/2019
source('./class05.R', echo = T)
##
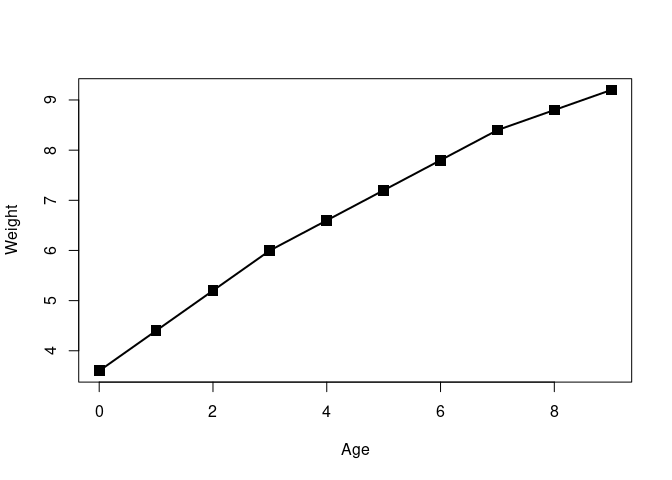
## > weight.table <- read.table(file = "bimm143_05_rstats/weight_chart.txt",
## + header = TRUE, sep = "\t")
##
## > plot(weight.table$Age, weight.table$Weight, xlab = "Age",
## + ylab = "Weight", pch = 15, cex = 1.5, lwd = 2, typ = "o")
source('./class05_2.R', echo = T)
##
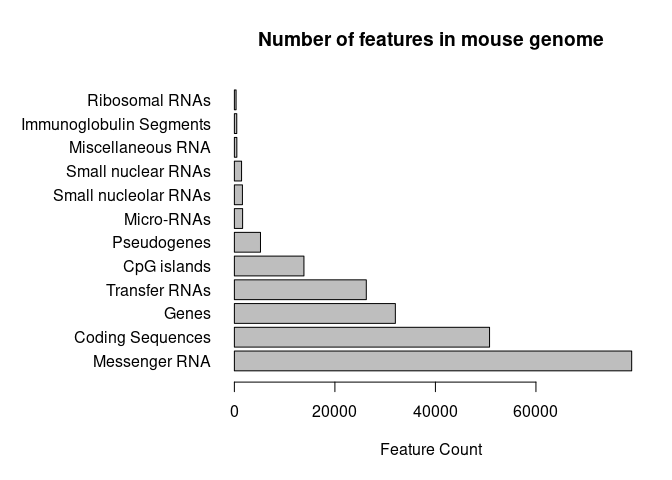
## > features <- read.table(file = "bimm143_05_rstats/feature_counts.txt",
## + header = TRUE, sep = "\t")
##
## > par(mar = c(5.1, 12, 4.1, 2.1))
##
## > barplot(features$Count, horiz = TRUE, xlab = "Feature Count",
## + names.arg = features$Feature, las = 1, main = "Number of features in mouse geno ..." ... [TRUNCATED]
source('./class05_3.R', echo = T)
##
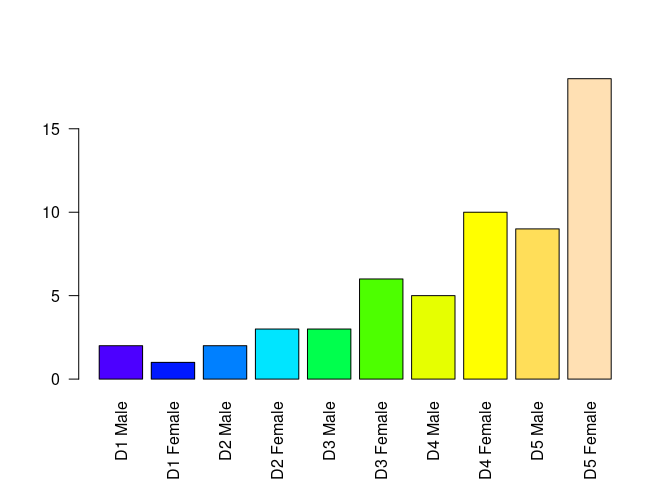
## > mf_cnts <- read.table(file = "bimm143_05_rstats/male_female_counts.txt",
## + header = TRUE, sep = "\t")
##
## > barplot(mf_cnts$Count, names.arg = mf_cnts$Sample,
## + las = 2, col = topo.colors(10))
##
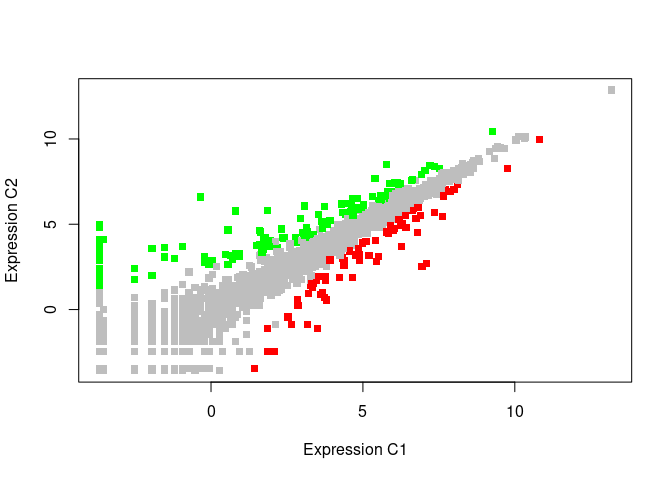
## > up_down <- read.table(file = "bimm143_05_rstats/up_down_expression.txt",
## + header = T, sep = "\t")
##
## > table(up_down$State)
##
## down unchanging up
## 72 4997 127
##
## > palette(value = c("red", "gray", "green"))
##
## > plot(up_down$Condition1, up_down$Condition2, xlab = "Expression C1",
## + ylab = "Expression C2", col = up_down$State, pch = 15)